| Note: This tutorial assumes that you have completed the previous tutorials: Markers: Basic Shapes. |
| |
マーカ: 点と線(C++)
Description: 点や線をrvizに送るためのvisualization_msgs/Markerメッセージをどのように使うかについて解説しますTutorial Level: BEGINNER
Next Tutorial: Interactive Markers: Getting Started
イントロ
Markers: Basic Shapesの中で、visualization markersを使用して、単純な形状をどのようにしてrvizに送るかを勉強しました。もっと単純なものを送ることもできます。このチュートリアルでは、POINTS(点), LINE_STRIP, LINE_LISTのマーカのタイプを紹介します。タイプの完全なリストは、Marker Display pageを参照してください。
Points, Line Strips, Line Listsを使う
POINTS, LINE_STRIP , LINE_LISTのマーカは全て、visualization_msgs/Markerメッセージのpointsメンバを使用します。POINTSタイプは、加えられた各点にpointを置きます。LINE_STRIP タイプは、各点をラインのセットのひとつの頂点として使います。point0はpoint1につながっていて、1は2、2は3というようにです。LINE_LISTのタイプは、各点のペアから非接続のラインを作ります。つまり、0と1、2と3というようになります。
とりあえず、コードを見てみましょう。
コード
  30 #include <ros/ros.h>
  31 #include <visualization_msgs/Marker.h>
  32
  33 #include <cmath>
  34
  35 int main( int argc, char** argv )
  36 {
  37   ros::init(argc, argv, "points_and_lines");
  38   ros::NodeHandle n;
  39   ros::Publisher marker_pub = n.advertise<visualization_msgs::Marker>("visualization_marker", 10);
  40
  41   ros::Rate r(30);
  42
  43   float f = 0.0;
  44   while (ros::ok())
  45   {
  46
  47     visualization_msgs::Marker points, line_strip, line_list;
  48     points.header.frame_id = line_strip.header.frame_id = line_list.header.frame_id = "/my_frame";
  49     points.header.stamp = line_strip.header.stamp = line_list.header.stamp = ros::Time::now();
  50     points.ns = line_strip.ns = line_list.ns = "points_and_lines";
  51     points.action = line_strip.action = line_list.action = visualization_msgs::Marker::ADD;
  52     points.pose.orientation.w = line_strip.pose.orientation.w = line_list.pose.orientation.w = 1.0;
  53
  54
  55
  56     points.id = 0;
  57     line_strip.id = 1;
  58     line_list.id = 2;
  59
  60
  61
  62     points.type = visualization_msgs::Marker::POINTS;
  63     line_strip.type = visualization_msgs::Marker::LINE_STRIP;
  64     line_list.type = visualization_msgs::Marker::LINE_LIST;
  65
  66
  67
  68     // POINTS markers use x and y scale for width/height respectively
  69     points.scale.x = 0.2;
  70     points.scale.y = 0.2;
  71
  72     // LINE_STRIP/LINE_LIST markers use only the x component of scale, for the line width
  73     line_strip.scale.x = 0.1;
  74     line_list.scale.x = 0.1;
  75
  76
  77
  78     // Points are green
  79     points.color.g = 1.0f;
  80     points.color.a = 1.0;
  81
  82     // Line strip is blue
  83     line_strip.color.b = 1.0;
  84     line_strip.color.a = 1.0;
  85
  86     // Line list is red
  87     line_list.color.r = 1.0;
  88     line_list.color.a = 1.0;
  89
  90
  91
  92     // Create the vertices for the points and lines
  93     for (uint32_t i = 0; i < 100; ++i)
  94     {
  95       float y = 5 * sin(f + i / 100.0f * 2 * M_PI);
  96       float z = 5 * cos(f + i / 100.0f * 2 * M_PI);
  97
  98       geometry_msgs::Point p;
  99       p.x = (int32_t)i - 50;
 100       p.y = y;
 101       p.z = z;
 102
 103       points.points.push_back(p);
 104       line_strip.points.push_back(p);
 105
 106       // The line list needs two points for each line
 107       line_list.points.push_back(p);
 108       p.z += 1.0;
 109       line_list.points.push_back(p);
 110     }
 111
 112
 113     marker_pub.publish(points);
 114     marker_pub.publish(line_strip);
 115     marker_pub.publish(line_list);
 116
 117     r.sleep();
 118
 119     f += 0.04;
 120   }
 121 }
コードの解説
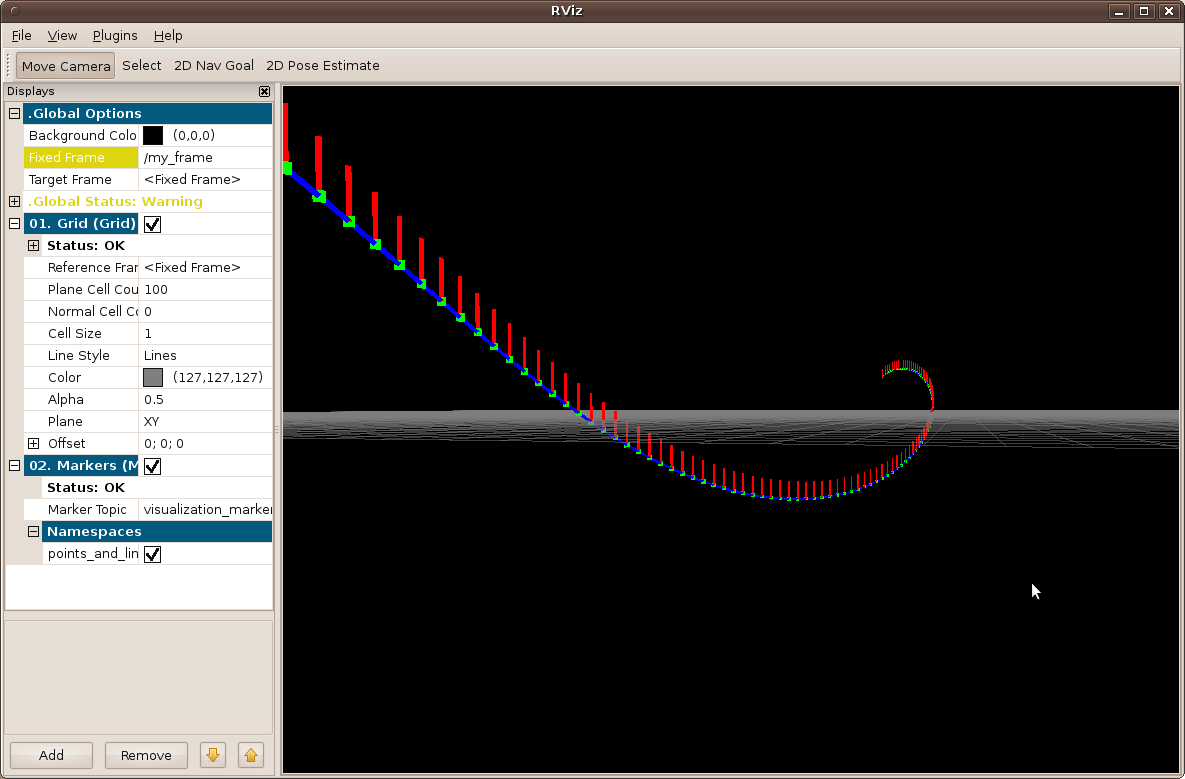
さて、コードを見ていきたいと思います。一つ前のチュートリアルで説明されているものは飛ばします。作られた全体のエフェクトは、それぞれの頂点から上の方に線が延びた螺旋を描きます。
  47     visualization_msgs::Marker points, line_strip, line_list;
  48     points.header.frame_id = line_strip.header.frame_id = line_list.header.frame_id = "/my_frame";
  49     points.header.stamp = line_strip.header.stamp = line_list.header.stamp = ros::Time::now();
  50     points.ns = line_strip.ns = line_list.ns = "points_and_lines";
  51     points.action = line_strip.action = line_list.action = visualization_msgs::Marker::ADD;
  52     points.pose.orientation.w = line_strip.pose.orientation.w = line_list.pose.orientation.w = 1.0;
ここで、3つのvisualization_msgs/Markerのメッセージをつくり、それらの共有データを初期化します。メッセージのメンバは0に設定し、ポーズのwメンバのみが設定されているということを利用できます。
3つのマーカに異なる3つの異なるidに割り当てます。points_and_linesの名前空間を使うことで、他のブロードキャスタと衝突しません。
マーカのタイプをPOINTS, LINE_STRIP , LINE_LISTにセットします。
scaleメンバは、これらのマーカのタイプぞれぞれで異なるものを意味します。POINTSマーカはx と yメンバをそれぞれ幅と高さとして利用する一方で、LINE_STRIP や LINE_LISTでは、xのコンポーネントのみを用いて、それは線の幅を意味します。Scaleの値はメートル単位です。
ここでは、点を緑に、線を青に、線のリストを赤に設定しました。
  92     // Create the vertices for the points and lines
  93     for (uint32_t i = 0; i < 100; ++i)
  94     {
  95       float y = 5 * sin(f + i / 100.0f * 2 * M_PI);
  96       float z = 5 * cos(f + i / 100.0f * 2 * M_PI);
  97
  98       geometry_msgs::Point p;
  99       p.x = (int32_t)i - 50;
 100       p.y = y;
 101       p.z = z;
 102
 103       points.points.push_back(p);
 104       line_strip.points.push_back(p);
 105
 106       // The line list needs two points for each line
 107       line_list.points.push_back(p);
 108       p.z += 1.0;
 109       line_list.points.push_back(p);
 110     }
螺旋を生成するのには、sin、cosを使用しています。POINTS と LINE_STRIPのマーカはともに、 各頂点の点のみを必要としますが、LINE_LISTは2つの頂点を必要とします.
マーカを可視化する
一つ前のチュートリアルでやった同様の方法でrvizを立ち上げてください。以下のようにです。 using_markersパッケージの中のCMakeLists.txtファイルを編集して、最後に以下の行を追加してください。:
rosbuild_add_executable(points_and_lines src/points_and_lines.cpp)
Then,
$ rosmake using_markers
add_executable(points_and_lines src/points_and_lines.cpp)
target_link_libraries(points_and_lines ${catkin_LIBRARIES})
そして、
$ catkin_make
すると、
$ rosrun rviz rviz &
$ rosrun using_markers points_and_lines
螺旋状の以下のようなものが見えるはずです:

次の段階
Marker Display pageはrvizのサポートするすべてのマーカとオプションのリストがあります。他のマーカをいくつか試しましょう!


